熱帯対流圏界層(TTL)における水蒸気"Match"
我々は、同じ空気塊を2回以上直接観測する手法("Match"法と呼ばれる)
を西部太平洋上空のTTLにおける水平移流に伴う大気脱水過程の研究に
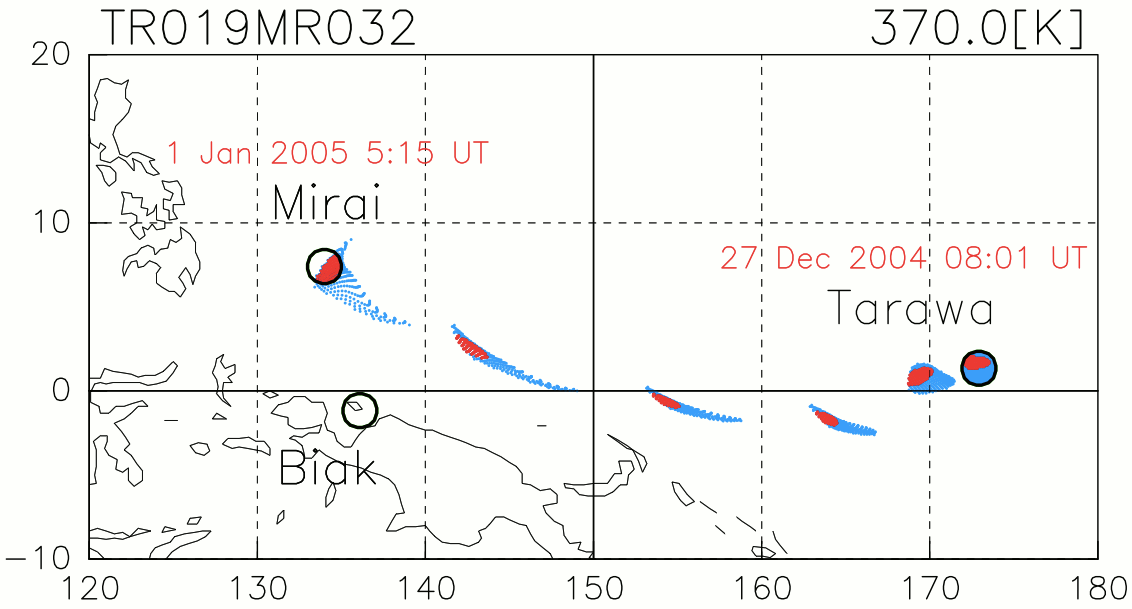
適用しました。等温位条件を仮定した流跡線解析により空気塊を
追跡し(図1)、2004年から2009年までの期間についてSOWERによる
ゾンデ観測により同じ空気塊が2回以上観測された事例("Match"事例)
を探索しました。
"Match"事例を特定するために、空気塊の代表性、等温位条件の有効性、
深い対流の貫入の有無、ゾンデ観測データと客観解析データの整合性の
検証など、徹底的なスクリーニングを行いました。
このような解析を経て特定された"Match"事例から、
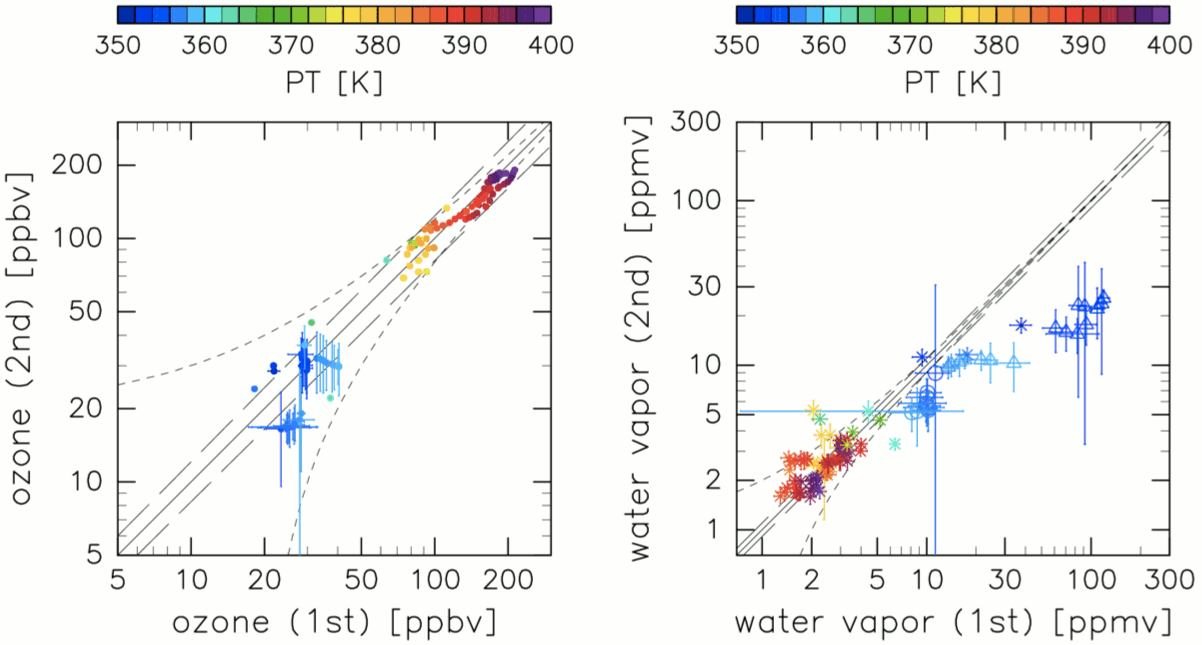
1度目に観測された空気塊の水蒸気量に比べて2度目(数日後)のそれが
減少している事例を見い出しました(図2)。
これはTTLにおける水平移流に伴う脱水を初めて観測的にとらえたもの
と言えます。
(Inai et al. (2013),
Dehydration in the tropical tropopause layer estimated
from the water vapor match,
ACP)

図1:タラワから計算された流跡線群の例。 青点と赤点はタラワを中心とした"Match"半径(緯度経度1度)の 円領域から計算されている。そのうち赤点のみが2回目の観測点となる 観測船「みらい」を中心としたマッチ半径の円領域にも含まれる (つまり赤点群が"Match"した空気塊である)。 フットプリントは24時間毎であり、2004年12月27日にタラワで 観測された空気塊が約5日後に再び「みらい」で観測されている。

図2:流跡線解析と全てのスクリーニングを経て 特定された"Match"事例について、オゾン混合比(左パネル)と 水蒸気混合比(右パネル)についての1回目の観測値と2回目の観測値の散布図。 右パネルにプロットされたマークは水蒸気センサーの違いを表しており、 1回目観測と2回目観測がそれぞれCryogenic Frostpoint Hygrometer(CFH) とCFHの場合が+、CFHとSnow White(SW)の場合が△、SWとSWの場合が○である。
Volcanic Aerosols and Cirrus
A Mie-scattering depolarization lidar has been operated at Biak,
Indonesia during SOWER campaigns to observe cirrus variations
in the TTL. Figure 3 shows a very interesting case where cirrus
clouds exist within an aerosol layer originated probably
from a volcanic eruption (Mount Merapi, Indonesia, in October 2010).
Analysis of lidar data together with data from balloon-borne
optical particle counters and CFH suggests that cirrus clouds formed
with solid sulfate particles in tropical upper troposphere.
(Shibata et al. (2012),
Cirrus cloud appearance in a volcanic aerosol layer around the tropical cold point tropopause over Biak, Indonesia, in January 2011,
JGR)

Figure 3. (a) Time-altitude plot of lidar backscattering coefficient at the wavelength of 532 nm on 12 January 2011. (b) Time-altitude plot of particle depolarization ratio at 532 nm. The depolarization by the aerosol layer was very small or not detectable. At 03:00 to 06:00 LT, enhanced depolarization was seen at the altitudes between 17.5 and 18 km. The depolarization at these altitudes is as large as 0.5. (c) Time-height plot of color ratio (CR) on 12 January. The cirrus cloud layer shows a CR similar to that of the lower cirrus clouds. CR in the aerosol layer is smaller than 1, a value typical for aerosols.
Decadal Variations of Water Vapor in the Tropical Lower Stratosphere
Water vapor variations in the tropical lower stratosphere were
investigated on seasonal, quasi-biennial oscillation (QBO),
and decadal time scales using balloon-borne cryogenic
frost point hygrometer data taken between 1993 and 2009
during various campaigns including the Central Equatorial Pacific
Experiment (March 1993), campaigns once or twice annually during
the SOWER project in the eastern Pacific (1998–2003) and
in the western Pacific and Southeast Asia (2001–2009),
and the Ticosonde campaigns and regular sounding at Costa Rica
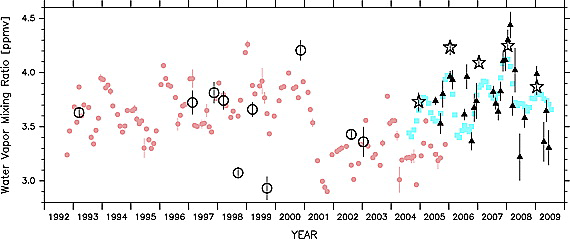
(2005–2009). Figure 4 shows time series of cryogenic frost point
hygrometer data averaged in a lower stratospheric layer
together with two satellite datasets (the Halogen Occultation
Experiment (HALOE) and Aura Microwave Limb Sounder (MLS)),
showing the existence of decadal variations: The mixing ratios
were higher and increasing in the 1990s, lower in the early 2000s,
and probably slightly higher again or recovering after 2004.
(Fujiwara et al. (2010),
Seasonal to decadal variations of water vapor in the tropical lower stratosphere observed with balloon-borne cryogenic frostpoint hygrometers, JGR)

Figure 4. Time series of water vapor mixing ratio averaged for 68-37 hPa using NOAA FPH and CFH data taken from the SOWER and Ticosonde campaigns and 10N-10S satellite HALOE and MLS data. Open circles indicate NOAA FPH campaign averages, and open stars indicate SOWER CFH campaign averages. Closed triangles indicate Ticosonde CFH monthly averages. Closed circles colored pink indicate HALOE monthly averages (sunrise and sunset data are mixed), and closed squares colored light blue indicate MLS monthly averages. Vertical bars show the standard error of the mean. For satellite data, the bars are generally smaller than the symbols in size.
