
Water Vapor Match in the Tropical Tropopause Layer
We apply the match technique, whereby the same air mass is
observed more than once (termed as a "match"), to study the
dehydration process associated with horizontal advection in the
Tropical Tropopause Layer (TTL) over the western Pacific.
The matches are obtained from the SOWER campaign network
observations during northern winters of 2004-2009 using
isentropic trajectories (Figure 1). For the matches identified,
extensive screening procedures are performed to verify
the representativeness of the air parcel and the validity
of the isentropic treatment and to check for possible water
injection by deep convection and consistency between
the sonde data and analysis field. Among the matches that
passed these screening tests, some of the matches indicated
a decrease in the amount of water vapor between the first
and second observations of the water vapor mixing ratio
(Figure 2). This finding represents the first direct evidence
of dehydration associated with horizontal advection in the TTL.
(Inai et al. (2013),
Dehydration in the tropical tropopause layer estimated
from the water vapor match,
ACP)
Figure 1. Example of a cluster of trajectories leaving Tarawa. The blue and red dots are the whole segments calculated from the circled region with a match radius (1 degree) centered at Tarawa. Only the red dots are included in both the first and second circular areas (i.e., those centered at Tarawa and Research Vessel (R/V) Mirai, respectively); therefore, they represent a match air parcel (see text for details). The footprints are drawn every 24 hour. The air parcel observed over Tarawa on 27 December 2004 (first observation) was observed again (second observation) over R/V Mirai after about 5 days.
Figure 2. Scatter plots showing the first versus the second observed values of ozone (left) and water vapor (right) mixing ratios for matches identified after applying all of the screening procedures. In the right panel, the symbols refer to the hygrometers, i.e., crosses, triangles, and circles indicate paired observations by Cryogenic Frostpoint Hygrometer (CFH) and CFH (for the first and second observations, respectively), CFH and Snow White (SW), and SW and SW, respectively.
Volcanic Aerosols and Cirrus
A Mie-scattering depolarization lidar has been operated at Biak,
Indonesia during SOWER campaigns to observe cirrus variations
in the TTL. Figure 3 shows a very interesting case where cirrus
clouds exist within an aerosol layer originated probably
from a volcanic eruption (Mount Merapi, Indonesia, in October 2010).
Analysis of lidar data together with data from balloon-borne
optical particle counters and CFH suggests that cirrus clouds formed
with solid sulfate particles in tropical upper troposphere.
(Shibata et al. (2012),
Cirrus cloud appearance in a volcanic aerosol layer around the tropical cold point tropopause over Biak, Indonesia, in January 2011,
JGR)

Figure 3. (a) Time-altitude plot of lidar backscattering coefficient at the wavelength of 532 nm on 12 January 2011. (b) Time-altitude plot of particle depolarization ratio at 532 nm. The depolarization by the aerosol layer was very small or not detectable. At 03:00 to 06:00 LT, enhanced depolarization was seen at the altitudes between 17.5 and 18 km. The depolarization at these altitudes is as large as 0.5. (c) Time-height plot of color ratio (CR) on 12 January. The cirrus cloud layer shows a CR similar to that of the lower cirrus clouds. CR in the aerosol layer is smaller than 1, a value typical for aerosols.
Decadal Variations of Water Vapor in the Tropical Lower Stratosphere
Water vapor variations in the tropical lower stratosphere were
investigated on seasonal, quasi-biennial oscillation (QBO),
and decadal time scales using balloon-borne cryogenic
frost point hygrometer data taken between 1993 and 2009
during various campaigns including the Central Equatorial Pacific
Experiment (March 1993), campaigns once or twice annually during
the SOWER project in the eastern Pacific (1998–2003) and
in the western Pacific and Southeast Asia (2001–2009),
and the Ticosonde campaigns and regular sounding at Costa Rica
(2005–2009). Figure 4 shows time series of cryogenic frost point
hygrometer data averaged in a lower stratospheric layer
together with two satellite datasets (the Halogen Occultation
Experiment (HALOE) and Aura Microwave Limb Sounder (MLS)),
showing the existence of decadal variations: The mixing ratios
were higher and increasing in the 1990s, lower in the early 2000s,
and probably slightly higher again or recovering after 2004.
(Fujiwara et al. (2010),
Seasonal to decadal variations of water vapor in the tropical lower stratosphere observed with balloon-borne cryogenic frostpoint hygrometers,
JGR)
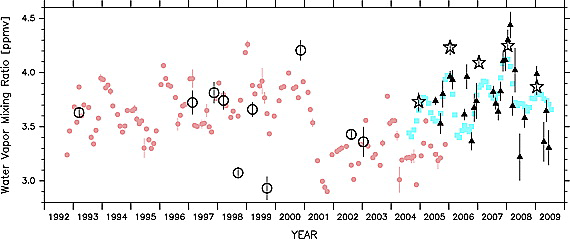
Figure 4. Time series of water vapor mixing ratio averaged for 68-37 hPa using NOAA FPH and CFH data taken from the SOWER and Ticosonde campaigns and 10N-10S satellite HALOE and MLS data. Open circles indicate NOAA FPH campaign averages, and open stars indicate SOWER CFH campaign averages. Closed triangles indicate Ticosonde CFH monthly averages. Closed circles colored pink indicate HALOE monthly averages (sunrise and sunset data are mixed), and closed squares colored light blue indicate MLS monthly averages. Vertical bars show the standard error of the mean. For satellite data, the bars are generally smaller than the symbols in size.